BI charts – Unity 3D
Demo was developed for demonstrating possibilities of building BI applications by Unity 3D engine. You can easily achieve a quick results with a lot of business benefits for example:
- multiplatform standalone applications for various platforms:
- Windows (*.exe, windows store apps, etc.)
- Android standalone applications
- iOS standalone applications
- Online web app
- Microsoft hololens for augmented reality
- Or other platforms for VR chart dashboards
- managing one project into Unity 3d
- connecting to various data sources from .NET C#
- JSON – connect to public online interfaces,
- XML – local Unity data source for objects configuration
- Online Web services
- etc.
Short demo screenshot video:
Demo application screens:
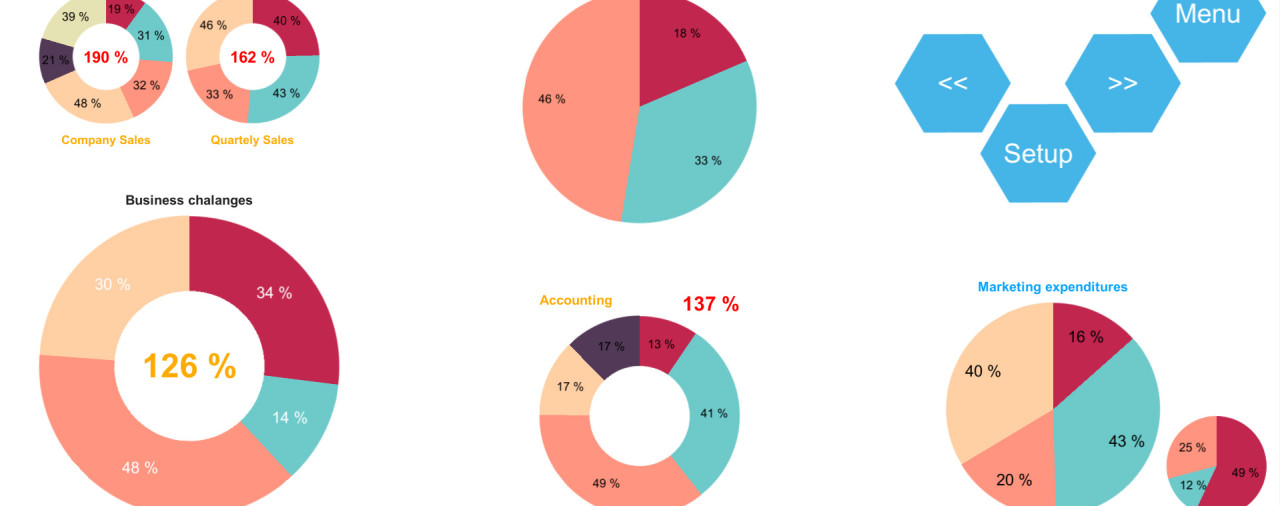
1/ Screen – pie and doughnut chart example made by one prefab:
the Chart prefab is describe below in next chapters – possibilities of configuration and possibilities of connecting to various data sources.

2/ JSON timer – it is demostrate data loading from JSON data source into Unity 3D:
It works like a clock or watch. Data are synchronize each 3 seconds.

3/ Custom doughnut and bar charts:
At the first time, I tried to build custom chart dashboard. After this experience I decided to build a Pie chart prefab, because you are able to build complicated chart configuration in a few hours.

4/ 3D chart example – configuration: 2 x 8:
This type of chart was build accidentally – it is also fully configurable – number of rows and cols and also data binding. I want to improve this demo – it could be interesting to join this concept of 3d charts with Virtual Reality or Augmented Reality applications. It means that you can have information about quarterly sales next to you in your desk.
Or you can see a number of open / in progress / and closed service tickets – on your desk, or on the wall in your office with 5 minutes data update.

4.1/ 3D chart second example – configuration: 1 x 15:

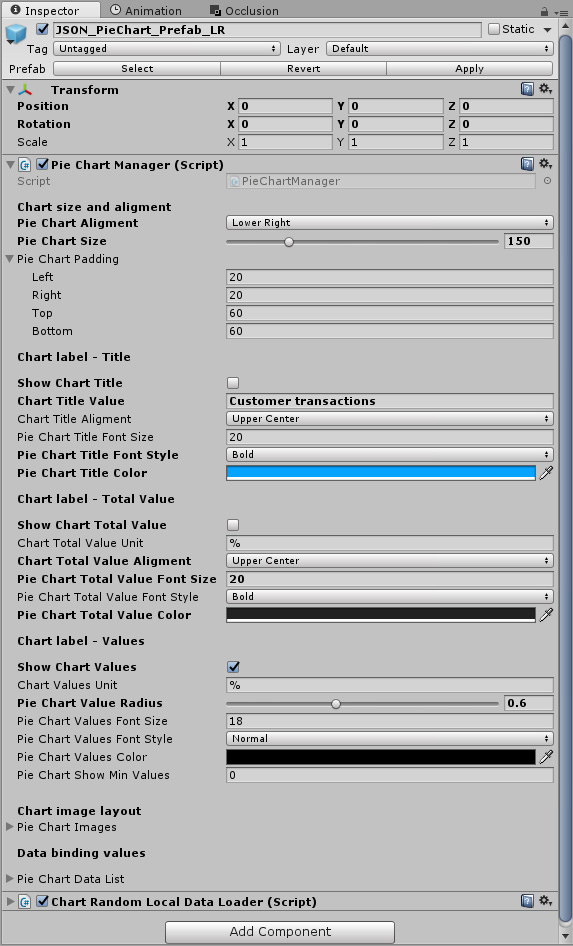
5/ Pie chart prefab settings / basic customization:
These images demonstrate possibilities of customization of general Unity Chart prefab to achieve chart customization which you need for your project.
You can customize:
- chart aligment – 6 posibilities:
- from left top, through middle center to right down
- Chart size from 50px to 500px
- Chart padding – allows you to visualize more than 6 charts in one screen
- Chart labels configuration
- you can manage 3 types of labels:
- chart title
- chart total value
- chart values including radius setting
- it allows you to shown labels
- inside chart – radius 0.75 or less
- outside chart – radius 1.2 or more
- it allows you to shown labels
- For each type of label you can:
- set aligment
- set font size
- set font style
- set font color
- set units by string
- for example: %, EUR, etc.
- you can manage 3 types of labels:
- Chart images configuration
- you can update all of slice background images by your own custom images
- you can create doughnut charts, pie charts
- you can use any color pallete as you want
- you can update all of slice background images by your own custom images
- Local Data set
- you can set the local data for the chart without connecting to any data source
- it allows you to make a static charts, if you need it ;o)
6/ Pie chart prefab various customizations:
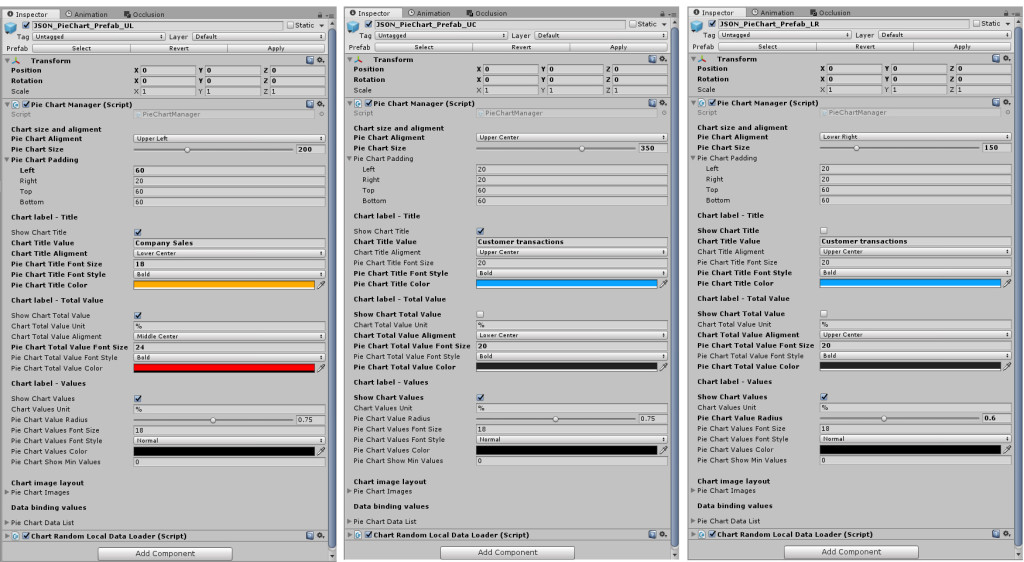
7/ Pie chart prefab data source manager.
You can choose between two datasources:
- Random Local Data loader – float generator
- Random JSON Data loader – float generator
The chart is ready to visualize any type of data from different data sources. You can also easily developed your own data connector.
